GREAT NICOBAR ISLAND PROJECT
- The Great Nicobar Island Project is a significant infrastructure development initiative undertaken by the Indian government on Great Nicobar Island, part of the Andaman and Nicobar Islands in the Indian Ocean. The project aims to transform the island into a strategic and economic hub.
- A deep-draft international container transshipment terminal is planned to be developed at Galathea Bay. This port is expected to serve as a key shipping hub in the region, facilitating trade and reducing dependency on transshipment ports in other countries
- An international airport is proposed to improve connectivity to the island, both for tourism and strategic purposes. This airport will be capable of handling wide-bodied aircraft and will enhance the island's accessibility
- To support the infrastructure and population growth, a gas- and solar-based power plant will be developed. This plant aims to provide a reliable and sustainable energy source for the island's needs
- A modern township with residential, commercial, and recreational facilities is planned to accommodate the increased population and workforce that the project will attract. This township is expected to have state-of-the-art amenities and infrastructure
- Great Nicobar Island is situated near the Malacca Strait, one of the world's busiest shipping lanes. Developing this island will enhance India's strategic presence in the Indian Ocean Region, particularly in terms of maritime security and trade control
- The project aims to boost the local economy by creating job opportunities and attracting investments. Improved infrastructure and connectivity are expected to stimulate tourism and other economic activities on the island
- Enhancing connectivity through the transhipment port and international airport will integrate Great Nicobar Island more closely with the global and regional trade networks, potentially making it a key logistical and commercial hub
- The project has raised concerns about its potential impact on the island's rich biodiversity and ecosystems. Great Nicobar Island is home to unique flora and fauna, including endangered species. Ensuring sustainable development practices and environmental protection measures will be crucial
- There are concerns about the impact on local communities, particularly indigenous tribes such as the Nicobarese and Shompen. Ensuring that their rights and livelihoods are protected is a key consideration for the project
- The project's emphasis on using renewable energy sources like solar power and promoting eco-friendly practices is an effort to mitigate environmental concerns. However, balancing development with conservation will be an ongoing challenge
|
Great Nicobar
Great Nicobar is the largest of the Nicobar Islands, part of the Union Territory of Andaman and Nicobar Islands in India. It is located in the Indian Ocean, near the western entrance of the Malacca Strait, which is a key maritime route for international trade.
Here are some key aspects of Great Nicobar:
|
- The Bay of Bengal and Indian Ocean region are critically important for India's strategic and security interests, especially as the Chinese People’s Liberation Army Navy aims to increase its presence in these waters.
- India is concerned about the buildup of Chinese naval forces at key Indo-Pacific chokepoints, particularly Malacca, Sunda, and Lombok. China's efforts to extend its influence in the area include constructing a military facility on the Coco Islands in Myanmar, located just 55 km north of the Andaman & Nicobar Islands.
- Earlier this year, The Indian Express reported significant upgrades to the military infrastructure on the Andaman & Nicobar Islands.
- This includes modernizing airfields and jetties, creating new logistics and storage facilities, establishing a base for military personnel, and enhancing surveillance capabilities.
- The goal of these upgrades is to support the deployment of more military forces, larger warships, aircraft, missile batteries, and troops.
- Maintaining close surveillance over the area surrounding the archipelago and establishing a strong military presence on Great Nicobar is crucial for India's national security
- The proposed infrastructure upgrade has faced opposition due to its potential ecological threat to the islands. Wildlife conservation researchers, anthropologists, scholars, civil society members, and the Congress party have raised concerns about the devastating impact on the Shompen, a particularly vulnerable tribal group (PVTG) of hunter-gatherers, who have an estimated population of a few hundred individuals residing in a tribal reserve on the island.
- Critics claim the project infringes on the rights of the tribal population and will harm the island’s ecology, including the felling of nearly a million trees. There are fears that the port project will damage coral reefs, affecting the local marine ecosystem, and pose a threat to terrestrial species like the Nicobar Megapode bird and leatherback turtles, which nest in the Galathea Bay area.
- A statement by senior Congress leader and former Environment Minister Jairam Ramesh highlighted that the proposed port is in a seismically active zone, which experienced permanent subsidence of about 15 feet during the 2004 tsunami.
- The statement also accused the local administration of insufficiently consulting the Tribal Council of Great and Little Nicobar Islands as required by law.
- In November 2022, the tribal council withdrew a no-objection certificate it had issued for the diversion of about 160 sq km of forest land, citing inadequate information provided to them.
- In April 2023, the Kolkata Bench of the National Green Tribunal (NGT) chose not to interfere with the environmental and forest clearances granted to the project. However, the Tribunal ordered the formation of a high-power committee to review the clearances. There is still no clarity on whether the committee, mainly composed of government representatives, has submitted its report
|
For Prelims: National Green Tribunal (NGT), Great Nicobar Island, Coastal Regulation Zones, Turtles, Dolphins, Particularly Vulnerable Tribal Groups (PVTGs), Mangroves, Great Nicobar Biosphere Reserve
For Mains: Significance and Issues Related to Great Nicobar Island Project
|
|
Previous Year Questions
1. Which one of the following pairs of islands is separated from each other by the ‘Ten Degree Channel’? (2014) (a) Andaman and Nicobar Answer (a) 2. Which of the following have coral reefs? (2014)
Select the correct answer using the code given below: (a) 1, 2 and 3 only Answer (a) 3. In which one of the following places is the Shompen tribe found? (2009) (a) Nilgiri Hills Answer (b) |
BIRSA MUNDA
- "Janjatiya Gaurav Divas," or Indigenous People's Pride Day, is celebrated in India to honor and recognize the rich cultural heritage, traditions, customs, and contributions of the indigenous or tribal communities in the country.
- The day aims to raise awareness about the unique identities, languages, art, crafts, rituals, and knowledge systems of these tribal groups. It acknowledges their significant role in the cultural mosaic of India and promotes respect for their way of life.
- Moreover, the celebration of Janjatiya Gaurav Divas serves as a platform to highlight the challenges faced by indigenous communities, such as issues related to land rights, socio-economic disparities, cultural preservation, and access to education and healthcare. It endeavors to create a sense of pride and empowerment among these communities while also fostering inclusivity and understanding among the broader population regarding their diverse cultures and lifestyles.
3.Who was Birsa Munda?

- Birsa Munda, a youthful freedom fighter and tribal leader, is renowned for his fervent activism in the late 19th century, symbolizing a potent opposition to British rule in India. Hailing from the tribal regions of Bihar and Jharkhand, his accomplishments are notably exceptional as he attained them before turning 25. Jharkhand was established in honor of his impact on the national movement, marking his birth anniversary in 2000.
- Born on November 15, 1875, Birsa grew up migrating across villages with his parents, belonging to the Munda tribe in the Chhotanagpur Plateau. His initial education was under Jaipal Nag's tutelage at Salga, where he later converted to Christianity at the recommendation of his teacher to attend a German Mission school. However, he eventually left the school.
- The influence of Christianity shaped his later religious perspectives. Acquainted with British colonial rule and missionary attempts to convert tribals, Birsa initiated the faith of 'Birsait.' This faith garnered followers from the Munda and Oraon communities, posing a challenge to British conversion endeavors.
- Between 1886 and 1890, Birsa spent substantial time in Chaibasa, a hub for the Sardars agitation. Influenced by these activities, he became part of the anti-missionary and anti-government movement. By 1890, he was deeply involved in the resistance against British oppression of tribal communities.
- Birsa Munda was apprehended by British police on March 3, 1900, while resting with his tribal guerrilla army in Jamkopai forest, Chakradharpur. He passed away in Ranchi jail on June 9, 1900, at the young age of 25. Despite his short life and the movement's decline post his demise, Birsa Munda successfully mobilized tribal communities against the British. He compelled colonial officials to introduce laws safeguarding tribal land rights. His legacy endures through celebrations, and he remains a significant figure in literature, academia, and mass media.
4.Why Munda Rebellion is significant?
- The Munda Rebellion, also known as the Ulgulan or the Munda Uprising, was a significant tribal revolt against British colonial rule in India. It took place primarily in the region of Chotanagpur plateau, present-day Jharkhand, between 1899 and 1900.
- Led by Birsa Munda, a revered tribal leader and freedom fighter, the rebellion was a response to various grievances faced by the tribal communities, including exploitation by landlords, loss of traditional land rights, forced labor, and oppressive policies imposed by the British authorities and missionaries.
- The movement was deeply rooted in the cultural and religious beliefs of the Mundas and other tribal communities in the region. Birsa Munda, considered a charismatic figure, unified various tribes under a common cause to resist British oppression and reclaim their rights and autonomy.
- The rebellion was characterized by acts of civil disobedience, non-cooperation, and sporadic violent clashes with the British forces. Birsa advocated for a return to the traditional way of life and urged his followers to revolt against the oppressive practices enforced by the British administration and missionaries.
- However, the rebellion faced significant challenges, including lack of resources, arms, and unified leadership. The British swiftly suppressed the uprising by employing military force and eventually captured Birsa Munda. He was arrested in 1900 and later died in custody in Ranchi jail.
- Despite its relatively short duration, the Munda Rebellion holds historical significance as one of the earliest and notable uprisings against British colonial rule led by tribal communities in India. It symbolized the resistance of indigenous tribes against oppressive policies and became a catalyst for future movements advocating for the rights and autonomy of tribal populations in the country.
5. What are Particularly Vulnerable Tribal Groups (PVTGs)?
- PVTGs, previously referred to as primitive tribal groups, represent a subset of the Scheduled Tribes (STs), comprising those within the ST category recognized as particularly vulnerable compared to the general ST population. These endangered tribal groups were categorized by the government to prioritize advancements in their living conditions. The Ministry of Tribal Affairs identifies 75 PVTGs dispersed across 15 states and Union Territories.
- The initiative was initially announced during the 2023-24 budget and is being rolled out preceding the Assembly elections in Madhya Pradesh and Chhattisgarh. These states harbor a substantial tribal population, with Madhya Pradesh and Chhattisgarh recording ST proportions of 21.1% and 30.6%, respectively, as per the 2011 Census.
- PVTGs represent the most susceptible factions within tribal communities, typically possessing unique cultures, residing in remote areas, and maintaining minimal interaction with other communities.
- The program aims to comprehensively address the scattered, isolated, and hard-to-reach settlements of PVTGs by providing essential amenities such as infrastructure development including roads, telecommunications, electricity, secure housing, clean water, sanitation facilities, enhanced access to education, healthcare, nutrition, and sustainable livelihood opportunities.
- Approximately 28 lakh individuals from the 75 PVTGs inhabit 22,544 villages spread across 18 states and Union Territories within India.
6. Way forward
The norms of certain schemes will be relaxed to cover these remote habitations.
In addition to the 11 interventions, saturation of other government schemes such as PMJAY health insurance scheme, the Sickle Cell Disease Elimination programme, TB Elimination programme, 100% childhood immunisation, PM Surakshit Matrutva to ensure free of cost antenatal care to all women, PM Matru Vandana Yojana for cash benefit to mothers, PM Poshan, and PM Jan Dhan Yojana.
|
For Prelims: Indian Polity and Governance-Constitution, Political System, Panchayati Raj, Public Policy, Rights Issues, etc. For Mains: General Studies I: Modern Indian history from about the middle of the eighteenth century until the present significant events, personalities, issues. General Studies I: Social empowerment General Studies II: Government policies and interventions for development in various sectors and issues arising out of their design and implementation |
|
Previous Year Questions 1.Consider the following statements about Particularly Vulnerable Tribal Groups (PVTGs) in India: (UPSC CSE 2019) 1. PVTGs reside in 18 States and one Union Territory. 2. A stagnant or declining population is one of the criteria for determining PVTG status. 3. There are 95 PVTGs officially notified in the country so far. 4. Irular and Konda Reddi tribes are included in the list of PVTGs. Which of the statements given above are correct? A.1, 2 and 3 B.2, 3 and 4 C.1, 2 and 4 D.1, 3 and 4 Answer (C) |
Source: Indianexpress
INDIANS AND H1-B
- The H-1B visa program for skilled workers was introduced in 1990. These visas are initially issued for three years but can be extended to a maximum of six years.
- Since 2004, the issuance of new H-1B visas has been capped at 85,000 annually, with 20,000 reserved specifically for foreign students who hold master’s degrees or higher from U.S. universities.
- This cap, however, does not apply to certain entities like universities, think tanks, and other non-profit research organizations, allowing additional visas to be issued beyond the limit.
- Applicants for H-1B visas must have a job offer from a U.S.-based sponsor, such as a company or institution. The U.S. government also grants extensions for individuals already working under H-1B visas.
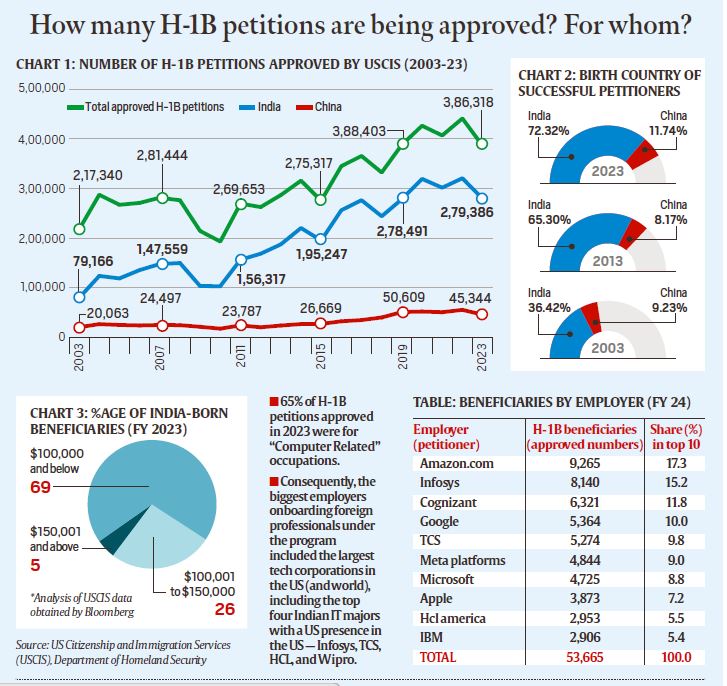
- During the fiscal year 2023 (October 2022 to September 2023), over 386,000 H-1B applications were approved. This figure includes nearly 119,000 new visas and approximately 267,000 extensions.
- The total number of approvals in 2023 reflects a decline from over 474,000 in the previous fiscal year, 2022
- Immigration remains one of the most divisive political topics in the United States. An October YouGov poll revealed that 14.6% of registered voters considered it the most critical issue in the upcoming election, a significant increase from just 2.1% in 2012.
- During election campaigns, much of the anti-immigration discourse centered on low-skilled labor migration. Beyond its inherent racial undertones, this narrative is driven by the perception that such immigration lowers wages and displaces jobs that might otherwise benefit the American working class.
- This demographic has long struggled with challenges like high unemployment, stagnant wages, inflation, a housing crisis, and other economic difficulties.
- Donald Trump effectively leveraged these concerns, pledging to improve conditions for the average American worker by restricting immigration.
- The current debate echoes many of the same themes as Trump’s rhetoric about Mexicans "stealing American jobs," though the focus has shifted to the immigration of skilled workers competing for higher-paying positions
- The H-1B visa program enables U.S. employers to hire foreign workers for roles requiring "a high level of skill" and "at least a bachelor’s degree," as outlined by the U.S. Department of Labor.
- Established in 1990, the program was designed to assist employers in filling roles that demand specialized skills not readily available within the U.S. workforce, allowing qualified foreign individuals to work temporarily in the United States.
- H-1B visas are typically issued for a maximum of six consecutive years. After this period, visa holders must either leave the U.S. for at least 12 months before returning or apply for permanent residency (a Green Card).
- Currently, the program has an annual limit of 65,000 new visas (the regular cap), with an additional 20,000 visas available for applicants holding master’s degrees or higher from U.S. universities. However, not all H-1B applications are subject to this cap, resulting in the total number of approved petitions often exceeding the cap.
- For example, in the fiscal year 2023, the United States Citizenship and Immigration Services (USCIS), under the Department of Homeland Security, approved 118,948 petitions for initial employment and 267,370 petitions for continuing employment.
- Certain applicants, such as those employed by higher education institutions, nonprofit organizations affiliated with such institutions, nonprofit research organizations, or government research entities, are exempt from the annual cap
- Indian nationals are the primary beneficiaries of the H-1B visa program, consistently accounting for over 70% of all approved H-1B petitions annually since 2015, according to U.S. government data. Chinese nationals rank a distant second, making up 12-13% of approvals since 2018.
- This significant representation of Indian professionals has drawn the attention of nativist MAGA Republicans, who have extended their anti-immigration rhetoric from low-skilled labor migration by Mexicans and Central Americans to include Indian workers in the tech industry.
- Their argument revolves around the claim that the H-1B program, originally designed to attract exceptional global talent, is being exploited by tech companies to fill lower- to mid-level positions at wages much lower than those expected by American workers.
- While proponents like Elon Musk argue that H-1B visas address a "permanent shortage of excellent engineering talent," critics counter that the issue is not a lack of skilled American workers but that they are deemed "too expensive to hire" by tech firms.
- This critique is supported by data. An analysis of 60,000 H-1B approvals from USCIS in the 2023 fiscal year, conducted by Bloomberg, revealed that nearly 70% of Indian H-1B recipients earned annual salaries below $100,000.
- For comparison, the median salary for IT professionals in the U.S. was $104,420 in May 2023, as reported by the U.S. Bureau of Labor Statistics. Approximately 25% of H-1B approvals for Indian professionals fell within the $100,000 to $150,000 salary range, while only 5% exceeded $150,000
|
For Prelims: H-1B visa, United States, U.S. Citizenship and Immigration Services, STEM fields, lottery system,
For Mains:
1. What are the implications of the new H-1B visa regime for US-India relations?
Discuss the measures can the Indian government take to support Indian IT workers affected by the new H-1B visa regime. (250 Words)
|
|
Previous Year Questions
1. Consider the following statements: (UPSC 2019)
1. Coal sector was nationalized by the Government of India under Indira Gandhi.
2. Now, coal blocks are allocated on lottery basis.
3. Till recently, India imported coal to meet the shortages of domestic supply, but now India is self-sufficient in coal production.
Which of the statements given above is/are correct?
A. 1 only B. 2 and 3 only C. 3 only D. 1, 2 and 3
Answer: A
2. Which of the following statements about town planning in British India in early 19th century is/are correct? (UPSC CAPF 2018)
1. The funds for town improvement were also raised through public lotteries.
2. The threats of epidemics gave an impetus to town planning in the early decades of 19th century.
Select the correct answer using the code given below
A.1 only B. 2 only C. Both 1 and 2 D. Neither 1 nor 2
Answer: C
|
THE REALITY BEHIND THE FALLING OF NET FDI
India’s net FDI has declined sharply despite strong gross inflows, underlining the impact of disinvestment/capital repatriation; investor classes, modes of entry, and exit strategies can have important implications for technology transfer, industrial development, and external sustainability
2. Background of the Situation
- India’s net Foreign Direct Investment (FDI) has witnessed a sharp decline over the past few years, sparking differing interpretations.
- Critics argue that the weakening net inflows reflect a deterioration in the country’s investment environment, whereas the Chief Economic Adviser maintains that robust gross FDI inflows and increasing investment in the manufacturing sector demonstrate the underlying strength of the economy.
- According to him, the subdued net FDI figures are largely the result of higher profit repatriation by foreign investors and growing overseas investments by Indian companies.
- However, this debate fails to address a more fundamental issue. By concentrating primarily on aggregate FDI figures, both perspectives overlook the evolving nature of international capital flows and the Balance of Payments (BoP) framework that determines how investment inflows and outflows are recorded and interpreted.
- For Balance of Payments accounting, net FDI is derived by subtracting outward investment and capital repatriation from total inward FDI inflows.
- India’s net FDI, which stood at a peak of $44.0 billion in 2020–21, declined dramatically to less than $1 billion in 2024–25 before recovering modestly to $7.6 billion in 2025–26.
- During the same period, gross FDI inflows reached $94.6 billion, highlighting the significant difference between gross and net investment figures.
- It is also important to understand the evolution of India’s FDI policy. When economic liberalization was introduced in 1991, the policy framework primarily sought to facilitate technology transfer, promote exports, and conserve foreign exchange reserves.
- Over time, however, the emphasis gradually shifted toward attracting larger volumes of foreign investment, while relatively less attention was paid to the long-term external payment obligations and the overall quality of investments entering the country
- Foreign Direct Investment (FDI) is commonly perceived as a long-term investment that transfers technology, managerial expertise, and productive capacity to the host economy.
- In reality, however, FDI consists of different categories of investors, each characterized by distinct objectives, investment strategies, and exit horizons.
- The first category is Real Foreign Direct Investment (RFDI), which includes conventional multinational corporations possessing advanced technology, globally recognized brands, and the expertise required to establish manufacturing and service operations.
- Such investments are typically strategic in nature and involve long-term commitments to the host country.
- The second category comprises financial investors, such as private equity funds, venture capital firms, sovereign wealth funds, and institutional asset managers.
- Unlike traditional multinational enterprises, these investors primarily seek capital appreciation and generally plan to exit their investments after achieving targeted returns.
- The third category consists of diaspora investments and Special Purpose Vehicles (SPVs). These investments often involve funds mobilized overseas and routed through offshore financial centres.
- In some cases, they may also include the practice of round-tripping, where Indian capital is invested abroad and subsequently reinvested into India through foreign jurisdictions.
- Data on remittance-level FDI for the four-year period from 2022–23 to December 2025–26 indicate that Real FDI accounted for approximately 41.9% of effective inflows. Financial investors contributed a comparable 40.5%, while the remaining 17.6% originated from diaspora investments and SPVs associated with India.
- The investment approach of financial investors naturally implies eventual exits, which can lead to significant capital repatriation.
- An illustrative example occurred in 2025, when Temasek of Singapore exited its investment in Schneider Electric India Ltd., reportedly earning $6.4 billion from an initial investment of $637 million made in 2020.
- During the same calendar year, total recorded divestments reached $52 billion, of which 45 major exits by foreign private equity and venture capital firms accounted for nearly $29 billion in capital outflows.
- An examination of effective FDI inflows also reveals a declining trend in investment directed toward India’s manufacturing sector over three successive four-year periods.
- Particularly noteworthy is the fact that Real FDI in manufacturing represented only 10.6% of total effective inflows during the latest four-year period, suggesting a reduced share of long-term productive investment in this crucial sector
- One significant limitation of relying on gross FDI figures is that they often combine genuine new investments with various corporate restructuring transactions.
- These include intra-group ownership transfers, mergers and acquisitions, share swaps, and the conversion of previously issued non-equity instruments, such as External Commercial Borrowings (ECBs) and convertible debentures, into equity.
- Although such transactions alter the ownership or capital structure of companies, they do not necessarily bring additional foreign capital into the Indian economy.
- As a result, gross FDI statistics may overstate the amount of fresh investment actually entering the country.
- Between 2014–15 and December 2025–26, India received approximately $560 billion in equity inflows. However, an estimated $40 billion of this total consisted of accounting and restructuring transactions rather than new capital injections.
- Consequently, these figures should be interpreted with caution when assessing the true magnitude of foreign investment.
- Moreover, a few exceptionally large corporate deals can significantly influence annual FDI numbers and sector-wise trends.
- High-value transactions involving companies such as Bosch and Meesho Technologies illustrate how individual restructuring or ownership changes can distort the overall picture of FDI inflows, even when they do not generate fresh investment for the economy
- Before examining the reasons behind India’s low or even negative net Foreign Direct Investment (FDI) in certain periods, it is important to clarify a common misconception. The official argument that profit repatriation is primarily responsible for reducing net FDI can be misleading.
- According to the Balance of Payments (BoP) framework, profits remitted abroad in the form of dividends are classified as investment income under the current account.
- While these payments contribute to widening the Current Account Deficit (CAD), they do not directly affect the calculation of net FDI.
- Instead, the principal factor behind subdued net FDI is disinvestment and the repatriation of capital, both of which are recorded in the financial account of the BoP.
- Similarly, the recent rise in Outward Foreign Direct Investment (OFDI) deserves a more nuanced interpretation than simply viewing it as evidence of the growing maturity of Indian corporations.
- Between 2023–24 and 2025–26, nearly 45% of India’s outbound investment, amounting to $65 billion, was directed toward the financial, insurance, and business services (FIB) sector.
- Among the destination countries, Singapore accounted for 27% of the total, while the United Arab Emirates (UAE) received 11%.
- A substantial portion of these investments was routed to holding companies and Special Purpose Vehicles (SPVs) rather than directly into operational businesses.
- These multidirectional capital movements, whether through GIFT City or other offshore jurisdictions, suggest that outward FDI can represent both genuine international expansion by Indian firms and the recycling or return of previously shifted capital.
- Consequently, a rise in OFDI should not automatically be interpreted as a sign of corporate maturity alone.
- While many Indian companies invest abroad to acquire technology, resources, or global market access, some investments may involve the re-routing of capital through different jurisdictions before it eventually returns to India
- Between 2022–23 and 2025–26, India witnessed substantial FDI inflows, but these were accompanied by equally significant outflows through various current and capital account transactions.
- Although gross inward equity FDI amounted to $317.8 billion (or $230.6 billion after excluding reinvested earnings), the pattern of associated outflows presents a far more intricate picture.
- A major component of these outflows was disinvestment and capital repatriation, recorded under the capital account, which totalled $178.9 billion. These outflows were largely driven by financial investors exiting their investments through mechanisms such as secondary market sales, strategic stake sales, initial public offering (IPO) exits, and share buybacks.
- They also included Offers for Sale (OFS) by foreign promoters in companies such as Hyundai and LG. In addition, some traditional foreign investors divested their holdings, as illustrated by Wistron’s sale of its Indian operations to the Tata Group.
- Another significant outflow arose from dividend remittances, which are recorded under the current account.
- During this period, multinational enterprises (MNEs) and their affiliates transferred approximately $118.9 billion abroad as profits distributed to their parent companies, excluding the portion retained as reinvested earnings.
- Outflows were also generated through payments for intellectual property rights (IPR), including royalties and licensing fees.
- These payments, attributable to MNE subsidiaries and affiliates and estimated at $46.6 billion (assuming they constituted about 75% of total IPR payments), often serve as an alternative mechanism for transferring profits to parent entities.
- Furthermore, Indian entities collectively remitted around $250 billion toward technical, consultancy, and service-related payments.
- However, distinguishing the share attributable to foreign-owned enterprises from that of purely domestic firms remains difficult due to data limitations.
- Even after excluding Outward Foreign Direct Investment (OFDI) and payments for technical and consultancy services, the combined outflows arising from disinvestment, dividend remittances, and IPR-related payments amounted to approximately $344.4 billion
- This indicates that for every dollar of fresh foreign investment entering India (excluding reinvested earnings), nearly $1.50 flowed out through these channels.
- The trend has become increasingly pronounced over the past decade. Between 2014–15 and 2017–18, about 56 cents flowed out for every dollar of fresh inflow.
- This ratio increased to 70 cents during 2018–19 to 2021–22 and has since risen to its current elevated level, reflecting a growing imbalance between fresh capital inflows and associated outflows
|
For Prelims: Foreign Direct Investment (FDI), initial public offering (IPO), Current Account Deficit (CAD)
For Mains: GS III - Economy
|
|
Previous Year Questions
1. Both Foreign Direct Investments (FDI) and Foreign Institutional Investor (FII) are related to investment in a country. (UPSC CSE 2011)
Which one of the following statements best represents an important difference between the two?
A.FII helps bring better management skills and technology, while FDI only brings in capital
B.FII helps in increasing capital availability in general, while FDI only targets specific sectors C.FDI flows only into the secondary markets, while FII targets primary market
D.FII is considered to the more stable than FDI
Answer (B)
|
TOTAL FERTILITY RATE (TFR)
2. About the Total Fertility Rate (TFR)
The Total Fertility Rate (TFR) is a key demographic indicator that helps us understand the average number of children a woman in a specific population will have during her lifetime, assuming current birth patterns persist. It's different from the crude birth rate, which simply measures the number of births per 1,000 people in a population in a given year.
What it measures
- The average number of children a woman will have throughout her reproductive lifespan.
- It considers age-specific fertility rates, which means it takes into account the different birth rates at different ages within the population.
- Provides a longer-term perspective on population dynamics compared to the crude birth rate.
Significance
- Helps assess population growth trends and predict future population size.
- Informs policy decisions related to education, healthcare, social security, and economic development.
- Understanding TFR is crucial for analyzing the potential demographic dividend, which refers to the economic and social benefits that can arise from a large working-age population due to declining fertility rates.
Calculation
- Summing the age-specific fertility rates (ASFRs) for all fertile age groups (typically 15-49 years) and multiplying by five.
- ASFRs represent the average number of births per 1,000 women in a specific age group.
Key TFR levels
- Replacement fertility rate: Around 2.1 children per woman, ensures population stability without growth or decline due to births and deaths (excluding migration).
- TFR below replacement: Indicates a declining population, with potential implications for workforce size and economic growth.
- TFR above replacement: Leads to population growth, requiring investments in infrastructure and resources to support the growing population.
3. What does the Total Fertility Rate (TFR) of 2.0 mean?
A Total Fertility Rate (TFR) of 2.0 means that, on average, each woman in the population is expected to give birth to two children over her reproductive lifetime. This value represents the replacement level of fertility, where each generation replaces itself in the population. When the TFR is around 2.0, it indicates that the population is stable, with births balancing deaths over time.
A Total Fertility Rate (TFR) of 2.0 indicates several key things
- Average Children per Woman: In that specific population, on average, a woman will have two children during her lifetime, assuming current birth patterns remain unchanged. This means that each generation of women is replacing itself, without population growth or decline due solely to births and deaths (excluding migration).
- Replacement Fertility Rate: A TFR of 2.0 is often referred to as the replacement fertility rate. This is because it signifies the level of fertility needed to maintain a stable population size over time, considering only births and deaths. However, it's important to note that the exact replacement level can vary slightly depending on mortality rates, particularly child mortality.
- Demographic Transition: A TFR of 2.0 suggests that the population is likely in the later stages of the demographic transition. This transition involves a shift from high birth and death rates to low birth and death rates. In this stage, populations typically experience a decline in fertility, followed by a decline in mortality, leading to a stabilization of population size.
- Global Context: While 2.0 is the replacement fertility rate, the global average TFR is currently around 2.3, indicating slight population growth. However, many developed countries have TFRs below replacement level, which can lead to an ageing population and potential challenges for social security systems and workforce size.
- Policy Implications: Understanding the TFR is crucial for policymakers in various areas like education, healthcare, social security, and economic development. A TFR below replacement may necessitate policies encouraging childbirth or attracting immigration to address potential workforce shortages. Conversely, a high TFR might require investments in infrastructure and resources to support a growing population.
4. What is the Replacement Fertility Rate?
The Replacement Fertility Rate (RFR) is the level of fertility required to maintain a stable population size in a given area, considering only births and deaths (excluding migration). This means that each generation of women has just enough daughters to replace themselves and their mothers in the population.
Key Points about RFR
- Typically around 2.1 children per woman This number varies slightly depending on a country's mortality rates, especially child mortality rates. Higher child mortality necessitates slightly higher fertility to ensure replacement.
- When the TFR matches the RFR, the population neither grows nor declines due to births and deaths.
- Reaching RFR suggests a population in the later stages of the demographic transition, characterized by declining birth and death rates.
- Though the global average TFR is 2.3 (slightly above RFR), many developed countries have TFRs below RFR, leading to ageing populations.
Significance of RFR
- Understanding RFR helps policymakers formulate effective policies in areas like education, healthcare, social security, and economic development.
- TFR below RFR may require policies to encourage childbirth or attract immigration to address potential workforce shortages and support ageing populations. Conversely, a high TFR might necessitate investments in infrastructure and resources to sustain a growing population.
- Analyzing TFR about RFR offers insights into potential population growth or decline, aiding in planning and resource allocation.
5. How is the Total Fertility Rate calculated?
The Total Fertility Rate (TFR) is calculated by considering the age-specific fertility rates (ASFRs) of a population.
- Age-specific fertility Rates (ASFRs) represent the average number of births per 1,000 women within a specific age group. Typically, ASFRs are calculated for five-year age groups ranging from 15-49 years, covering the typical childbearing years for women. Data for calculating ASFRs usually comes from population censuses or demographic surveys.
- Once you have the ASFRs for each age group, you need to sum them all up. This gives you the total number of births expected per 1,000 women across all fertile age groups.
- Since age groups may have different sizes, simply summing ASFRs wouldn't be entirely accurate. To account for this, the sum is multiplied by the average number of women in each age group. This ensures the TFR reflects the fertility rates across all age groups proportionally.
- Often, instead of using the actual number of women in each age group, a standard factor of "5" is used for convenience. This assumes that each age group has roughly the same number of women, which is a reasonable approximation for many populations.
Therefore, the TFR formula becomes: TFR = (Sum of ASFRs across all age groups) * 5
Example:
Imagine a hypothetical population with the following ASFRs:
- 15-19 years: 30 births per 1,000 women
- 20-24 years: 80 births per 1,000 women
- 25-29 years: 120 births per 1,000 women
- 30-34 years: 90 births per 1,000 women
- 35-39 years: 50 births per 1,000 women
- 40-44 years: 20 births per 1,000 women
- 45-49 years: 10 births per 1,000 women
Using the formula:
- TFR = (30 + 80 + 120 + 90 + 50 + 20 + 10) * 5
- TFR = 400 * 5
- TFR = 2000 births per 1,000 women
Therefore, in this example, the TFR is 2.0, indicating that on average, a woman in this population would have 2 children during her lifetime based on the current age-specific fertility rates.
6. The difference between birth rate and Total Fertility Rate (TFR)
While both birth rate and Total Fertility Rate (TFR) measure fertility within a population, they have key differences that offer distinct insights:
| Features | Birth Rate | Total Fertility Rate (TFR) |
| Definition | Number of births per 1,000 people in a year | Average number of children per woman throughout her life |
| Focus | Current fertility level | Long-term fertility pattern |
| Data | Requires population size and number of births | Requires age-specific fertility rates |
| Calculation | Simple division | Summing and adjusting age-specific fertility rates |
| Advantages | Easy to understand, tracks short-term trends | Considers age structure, reflects future potential, informs policy |
| Limitations | Ignores age structure, limited future insight, misleading in fluctuating populations |
Requires complex data, less intuitive, may not perfectly predict future |
7. About demographic dividend
A demographic dividend refers to the potential economic and social benefits that can arise when a large share of the population is in the working-age (typically 15-64 years) compared to the dependent populations (children and elderly). This shift in population structure is often caused by a decline in fertility rates without a corresponding decline in mortality rates, leading to a "bulge" in the working-age population.
Key Features
- A larger working-age population translates to a larger pool of available labour, potentially boosting economic growth and productivity.
- The ratio of dependents (children and elderly) to the working-age population decreases, leading to increased savings and investment as fewer resources are needed to support dependents.
- The potential for increased investments in education and healthcare due to a smaller dependent population, leading to a more skilled and healthy workforce.
Conditions for a Dividend
- A significant and sustained decline in fertility rates is crucial for the demographic dividend to occur.
- The benefits of a demographic dividend can only be realized if the working-age population is adequately educated, skilled, and healthy.
- Expanding job opportunities is essential to absorb the growing workforce and prevent unemployment.
Challenges and Considerations
- The demographic dividend may not be evenly distributed across regions or social groups, potentially leading to inequalities.
- Governments and businesses need to adapt policies and infrastructure to accommodate the changing population structure.
- Ensuring social security and healthcare for the ageing population is crucial to sustain the benefits of the dividend.
Examples
- Several East Asian countries, like China and South Korea, experienced significant economic growth due to their demographic dividends in the latter half of the 20th century.
- India is currently experiencing a demographic transition with a declining fertility rate, creating the potential for a future dividend. However, realizing this potential requires investments in education, healthcare, and job creation.
|
For Prelims: Viksit Bharat, Population control goal, Total Fertility Rate, Replacement Fertility Rate
For Mains:
1. Critically analyze the significance of Total Fertility Rate (TFR) in understanding population dynamics and formulating development policies in India. Discuss the potential challenges and opportunities associated with India's projected demographic transition. (250 Words)
2. What are the potential security implications of India's changing population structure? How can these be addressed through proactive policy measures? (250 Words)
3. Imagine you are part of the committee formed by the Finance Minister to study India's population growth. What key recommendations would you propose, considering both demographic trends and the aspirations of a Vikasit Bharat? (250 Words)
|
|
Previous Year Questions
1. The total fertility rate is: (HPPSC GS 2018) (MPSC 2015)
A. The birth of women divided by the total female population
B. The number of births divided by the total population
C. The number of children a woman will likely bear in her lifetime
D. The births to women of a given age divided by the total number of women at that age
Answer: C
Mains
1. "Empowering women is the key to control the population growth.’’ Discuss. (UPSC 2019)
2. Critically examine the effect of globalization on the aged population in India. (UPSC 2013)
3. Discuss the main objectives of Population Education and point out the measures to achieve them in India in detail. (UPSC 2021)
4. Define potential GDP and explain its determinants. What are the factors that have been inhibiting India from realizing its potential GDP? (UPSC 2020)
|
POLLUTION AND SUMMER
In March, the Commission for Air Quality Management in the National Capital Region and Adjoining Areas (CAQM) revoked all curbs under the Graded Response Action Plan (GRAP), signalling the end of the winter air pollution in Delhi.A month later, as temperatures rose, it reimposed Stage 1 of the GRAP to combat summer air pollution. It was briefly revoked and reimposed again in May, while North India was reeling under heatwaves.
2. Why Are Urban Areas Experiencing Pollution Episodes During Summer?
- Cities such as Delhi and those across the Indo-Gangetic Plain are typically associated with severe winter smog. During winter, low temperatures, weak winds, and the region’s basin-like geography prevent pollutants from dispersing, causing them to accumulate near the surface.
- In contrast, summer conditions generally support better air quality. Stronger winds, intermittent thunderstorms that help remove pollutants, and higher temperatures promote vertical mixing of air, allowing pollutants to disperse more effectively.
- Nevertheless, Delhi recorded significant pollution levels during the summer of 2026. Between April 1 and May 31, daily average PM10 concentrations exceeded the 24-hour National Ambient Air Quality Standard (NAAQS) of 100 µg/m³ on 54 days.
- Furthermore, at least one Continuous Ambient Air Quality Monitoring Station (CAAQMS) reported hourly ozone concentrations above the prescribed limit of 180 µg/m³ on 40 days.
- This trend is not confined to Delhi alone. Several major Indian cities—including Mumbai, Chennai, Hyderabad, Bengaluru, and Kolkata—also experienced episodes of elevated PM10 and ozone concentrations during the same period.
- The intensity and frequency of these pollution events varied depending on local factors such as vehicular emissions, road dust, construction activities, industrial discharges, and dust storms.
- Mumbai, for example, has witnessed persistently high PM10 and ozone levels in recent years, largely driven by rapid construction, traffic congestion, and dust generation.
- Although Chennai experiences fewer PM10 exceedances, its dense traffic and high summer temperatures contribute to frequent ozone formation, making it particularly vulnerable to ozone pollution.
- The nature and causes of air pollution vary significantly between summer and winter.
- During winter, pollution levels tend to rise because of unfavorable meteorological conditions.
- Low temperatures, weak wind speeds, temperature inversions, and reduced atmospheric mixing trap pollutants close to the ground. As a result, particulate matter (PM2.5 and PM10) accumulates, leading to dense smog episodes, especially in cities across the Indo-Gangetic Plain.
- In contrast, summer generally provides conditions that help disperse pollutants. Stronger winds, greater atmospheric mixing, and occasional rainfall facilitate the dilution and removal of particulate matter.
- However, summer brings a different challenge—ground-level ozone pollution. Intense sunlight and high temperatures trigger chemical reactions between nitrogen oxides (NOx) and volatile organic compounds (VOCs), producing ozone.
- Consequently, while particulate pollution may decline compared to winter, ozone concentrations often increase during hot and sunny periods.
- Another key distinction lies in pollution sources. Winter pollution is often aggravated by biomass burning, domestic heating, and stagnant weather conditions.
- Summer pollution, on the other hand, is more strongly influenced by vehicular emissions, industrial activities, road and construction dust, and photochemical reactions driven by solar radiation.
- Therefore, winter air pollution is primarily characterized by the accumulation of particulate matter due to stagnant atmospheric conditions, whereas summer air pollution is marked by enhanced ozone formation and episodic increases in particulate matter from dust, traffic, and local emission sources
- Winter air pollution is largely characterized by high concentrations of fine particulate matter (PM2.5), whereas summer pollution is more strongly influenced by coarser PM10 particles and elevated ozone levels.
- Several pollution sources—including vehicular emissions, industrial activities, waste burning, agricultural residue burning, construction operations, and deteriorating road surfaces—contribute to poor air quality throughout the year. Seasonal factors, however, alter the dominant pollutants.
- During winter, additional emissions from biomass used for heating worsen particulate pollution. In summer, dust storms often raise PM10 concentrations, while intense heat and abundant sunlight promote the formation of ground-level ozone.
- Unlike particulate matter, ozone is a secondary pollutant and is not released directly into the atmosphere. It is produced through chemical reactions involving nitrogen oxides (NOx), primarily emitted by vehicles, and volatile organic compounds (VOCs) originating from industrial processes, vehicle exhaust, paints, solvents, and other sources.
- These reactions accelerate under strong sunlight and high temperatures, making hot summer days particularly conducive to ozone generation.
- Elevated levels of both ozone and particulate matter can adversely affect respiratory health and increase the risk of various air-related illnesses
- During summer, intense heating over the Indian subcontinent creates a vast low-pressure zone that often stretches westward toward Iran. The interaction between this low-pressure system and nearby high-pressure regions generates strong, hot winds.
- These winds can trigger large-scale dust storms and transport dust from the Thar Desert and parts of West Asia across northern and central India, sometimes reaching as far as the Bay of Bengal.
- Such events can cause PM10 concentrations to remain elevated for several days, similar to the widespread dust storms that affected northern India in 2018.
- Apart from these large regional events, India also experiences smaller and short-lived dust storms known as andhi. These storms are usually associated with thunderstorms.
- When powerful downdrafts from thunderstorms strike the ground, they lift loose soil and dust into the atmosphere, creating fast-moving dust clouds that generally dissipate within a few hours.
- While northern India frequently experiences dust transport associated with hot summer winds, cities such as Mumbai and Hyderabad are more likely to encounter dust episodes linked to localized thunderstorm activity.
- Human-induced factors further intensify PM10 pollution. Construction and demolition activities often increase after seasonal restrictions under the Graded Response Action Plan (GRAP) are relaxed following winter.
- Inadequate dust-control measures at construction sites allow significant amounts of particulate matter to enter the atmosphere.
- Additionally, the movement of vehicles over damaged or unpaved roads resuspends accumulated dust, especially during the dry summer season, further contributing to higher PM10 concentrations
- Although natural dust sources cannot be eliminated, their occurrence can be anticipated through effective forecasting systems. Following the severe dust storms of 2018 and recurring smog crises in earlier years, Delhi established the Air Quality Early Warning System (AQEWS), which now operates throughout the year.
- The system has subsequently been expanded to cities such as Jaipur and Mumbai, enabling authorities to forecast various air pollutants several days in advance.
- In addition to providing detailed meteorological updates for Delhi, AQEWS also issues three-day Air Quality Index (AQI) forecasts for nearly 140 cities across India.
- Similarly, the India Meteorological Department (IMD) releases weather forecasts multiple times daily at the national level.
- These forecasting tools should be leveraged by local administrations to disseminate timely warnings regarding dust storms, ozone episodes, and deteriorating air quality, allowing residents to take precautionary measures and limit their exposure.
- While natural sources require preparedness, pollution from human activities can be addressed through stricter enforcement and management practices. Dust-control measures at construction and demolition sites should remain in force throughout the year rather than being limited to the winter season.
- Research conducted by the Council on Energy, Environment and Water (CEEW) indicates that reducing the movement of heavy vehicles within construction zones can significantly decrease local particulate pollution.
- In Mumbai, the Brihanmumbai Municipal Corporation (BMC), in collaboration with CEEW, has implemented the Air Quality Decision Support System (AQDSS) to monitor construction-related emissions. Since October 2025, the system has assisted authorities in taking corrective action at more than 1,000 construction sites across the city.
- Addressing ozone pollution requires targeted reductions in emissions of nitrogen oxides (NOx) and volatile organic compounds (VOCs), which originate primarily from vehicles, industries, solvents, paints, and fuel combustion.
- This can be achieved through cleaner transportation systems, stricter emission standards, and improved regulatory compliance.
- Public participation can also make a difference. Initiatives such as Delhi’s “Red Light On, Gaadi Off” campaign, which encourages motorists to switch off their engines while waiting at traffic signals, help reduce unnecessary emissions that contribute to ozone formation.
- However, isolated interventions are insufficient. Indian cities require comprehensive and long-term summer air-quality management strategies. Delhi has implemented a dedicated Summer Action Plan since 2022, demonstrating a proactive approach.
- Similar frameworks should be adopted by other urban centres, integrating pollution forecasting, health advisories, construction and road-dust mitigation, and measures to curb ozone-forming emissions.
- Although summer weather often facilitates the dispersion of some pollutants, elevated temperatures and intense sunlight create conditions that favour the formation of others, particularly ozone.
- Therefore, urban air-quality management must address both winter and summer pollution challenges with equal urgency and sustained policy attention
|
For Prelims: Commission for Air Quality Management (CAQM), Graded Response Action Plan (GRAP), PM10
For Mains: GSIII - Environment and Ecology
|
|
Previous Year Questions
1.In the cities of our country, which among the following atmospheric gases are normally considered in calculating the value of the Air Quality Index? (2016)
Select the correct answer using the code given below: (a) 1, 2 and 3 only (b) 2, 3 and 4 only (c) 1, 4 and 5 only (d) 1, 2, 3, 4 and 5 Answer (b) |


